
Reports → one dashboard
You only know how the business is doing when someone sends you a report.
Most owners and managers ask the same questions every week: how much did we sell, what is late, which branch or team is behind, where is cash stuck. The answers exist, spread across sales, stock, delivery and finance, and someone spends hours collecting them into a report that is already old when it arrives. An operations dashboard collects those numbers automatically from the tools you already use and shows the few that matter, current, with a way to see the details behind each one.
Who this is for
- Owners of businesses with several branches or teams
- Operations managers who build weekly reports by hand
- Companies whose data sits in several tools and sheets
This is how it works today.
Each box is a moment where the work waits for a person. Keep scrolling and we will take out the ones a system can carry.
The weekly report today
By hand today: 5 steps
- Someone exports sales from one toolSales are read from the source automatically
- They collect stock and delivery from other sheetsThe other sources are joined in one place
- Numbers are pasted and checked in a big file
- The report is emailed, already a few days oldThe dashboard is current whenever you open it
- Questions about a number start a new roundEach number opens the details behind it
What we would build
- 01
Connections to your sources
Reading from your existing systems, databases or shared sheets, on a schedule, without retyping.
- 02
The few numbers that matter
Agreed with you: the daily and weekly figures you actually decide by, not every chart a tool can draw.
- 03
Drill-down to the details
From a total to the branch, the team, the order: so a question about a number is answered on the spot.
- 04
Alerts when something is off
A message when late orders pile up or stock falls below a level you set, instead of finding out at the weekly meeting.
- 05
Views per role
The owner sees the whole business; each manager sees their branch or team, on desktop or phone.
Why it matters
A report that takes a day to build arrives too late to change that week's decisions, and its numbers are often argued over because each person exported them differently. A dashboard built from the source fixes both: everyone looks at the same figure, and it is current. The bigger gain is time. The person who used to assemble reports goes back to their actual job, and managers stop waiting until the end of the week to notice a problem that was visible on Tuesday. Meetings also change: instead of debating whose numbers are right, the team discusses what to do about them.
What to build first
Start by writing down the questions you ask every week, then choose five to eight numbers that answer them. Build the first dashboard from the cleanest source you have, usually sales or orders, and make sure the numbers match what finance reports before adding more. Then join the next source, such as stock or delivery. If the data lives only in spreadsheets, the dashboard can start from them, and it often shows which part of the work should become a proper system next. Resist adding every chart at once; a dashboard people read every morning beats a large one nobody opens.
What it takes
The effort depends mostly on the sources: how many there are, whether they can be read automatically, and how clean the data is. A tool with a documented export or API is straightforward; data spread across hand-made sheets needs cleaning rules first. The number of views and roles matters less than people expect. NOVA starts by listing your sources and your questions, then proposes the first dashboard as a milestone you can check against your own numbers before anything else is added. Each number on the dashboard comes with a short note on where it comes from, so nobody has to guess what it means.
See how it could look
A quick concept from the Studio, built from NOVA's templates. Your real design is made with you.
Open in the StudioWork that shows how
- Web app
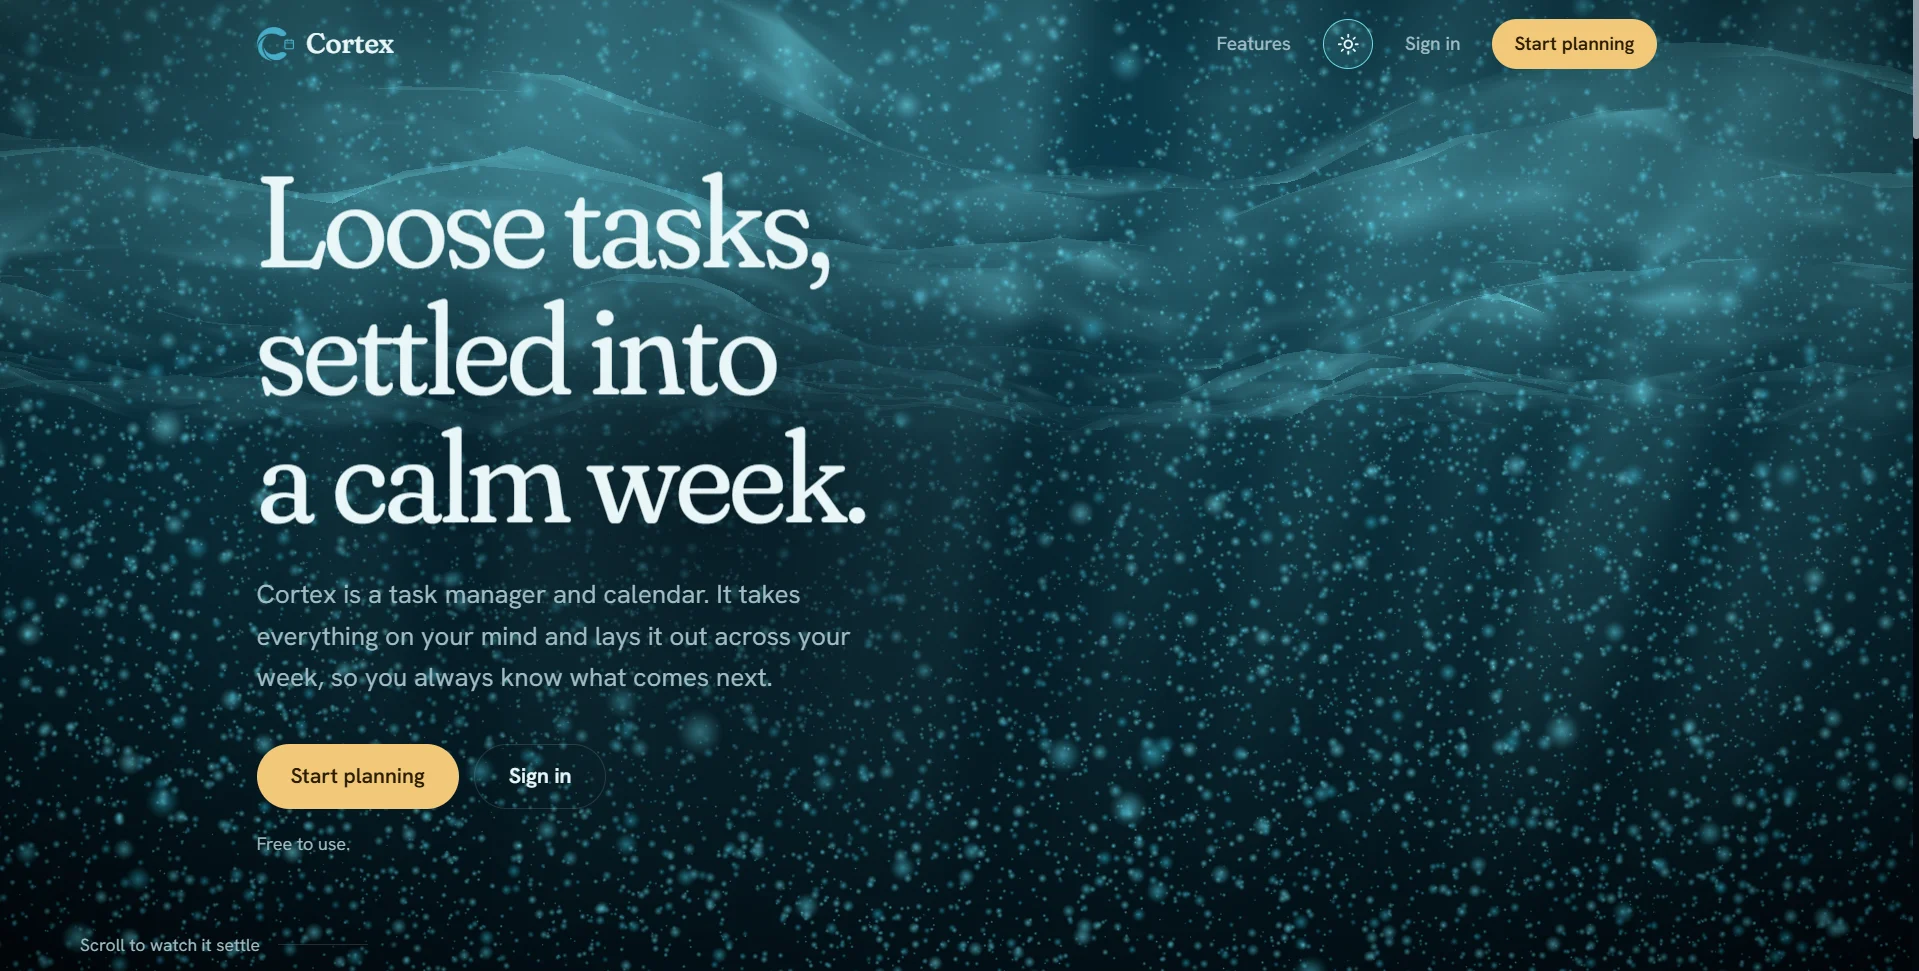
Cortex
A task manager and calendar that lays everything on your mind out across the week.
Case file →Visit site (opens in a new tab)
Questions
Can it read our data if it is only in Excel or Google Sheets?
Yes, as long as the sheets keep a consistent layout. We agree simple rules for the sheets so the numbers stay reliable.
Why not use a ready-made BI tool?
Sometimes that is the right choice. A custom dashboard makes sense when your sources are unusual, you need Arabic screens, or you want it inside the system your team already uses.
How current are the numbers?
As current as the sources allow: live where a system can be read directly, or refreshed on a schedule, for example every hour.
Can managers see only their own branch?
Yes. Each role sees the scope you decide, and the owner sees everything.
Sounds like your week?
Tell us how the work happens today. A person from NOVA reads every brief and answers.